|
|
|
| Thursday, July 14, 2005 |
First National Radar Test
Posted: 11:01:00 PM
|
Now playing: Namco - Sala de Masala 2000 (2:42)
I completed my first national radar test based on NWS's data. Not quite where I would like it to be, as there is ground clutter and in the northwest there are two strange looking lines that are obviously not supposed to be there... apparently NWS doesn't filter them out automatically. You can see a comparable image at approximately the same time to see the differences.
The good news is that the code obviously works. The bad news is that it took over 11 minutes to process all 136 radar sites in the continental US. NWS would have made two updates on each of those 136 radar sites in that time, not to mention that my radar data is now 11 minutes older than it was.
A good percentage of that time is spent downloading the radar data from NWS to begin with. Considering I'm on a shared T3 and it took about 3 to 4 minutes to download less than 2 MB of data, that's relatively slow.
But processing the files is taking the bulk of the time, and I may have to revisit the methods I use in order to get this to work faster. It could just be that I'm in debug mode, but I doubt that's going to help with the download speeds. Also, a lot of this is just computationally expensive. You figure there are 230 points I'm looking at for each degree around the radar - all 360 of them - for each of 136 radars. That's over 11 million pixels of data. Plus, since the map I'm displaying it on is a latitude/longitude map, I have to take into account that a nautical mile at 30 degrees of latitude is not the same as a nautical mile at 40 degrees of latitude. It gets complex, but I got a pretty good algorithm setup to do it.
So in short, there's a long way to go yet before this is practical, but the ground work and understanding is there, which is usually 80% of the work. I'll probably post more on this in the future.Labels: Coding, NWS, Screenshot
|
| Tuesday, July 12, 2005 |
More NWS stuff
Posted: 7:18:00 PM
|
Now playing: roncli, The Nightstalker - Everytime (5:24)
While this is not related at all to the project I was working on the other day, I thought I'd present this interesting test I've been doing.
Today I worked on parsing WSR-88D data. In short, it's data available for free on the NWS site that, when decoded, allows you to display radar images. I gotta say, this is pretty simple work when you know what you're doing. Check out this current image of Houston area radar.
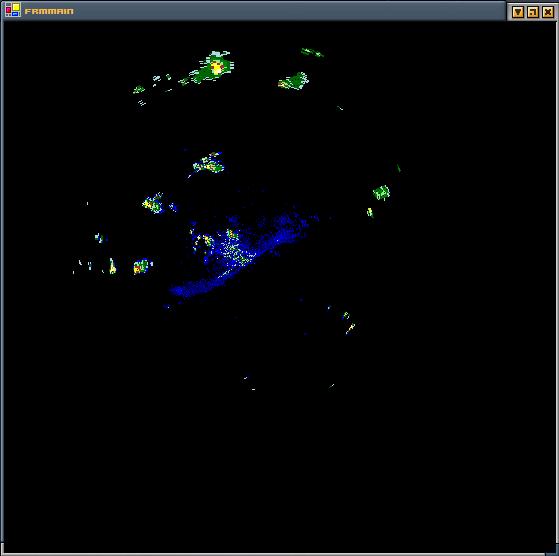
Although there are no borders, the ground clutter makes it easy to see Galveston and the bay. The northern end of the image reaches Dallas, while the western end extends beyond San Antonio and Austin.
It should only be a matter of putting the pieces together in order to get not only radar that's more pretty, but something that'll pave the way into locally cached radar loops for insane time ranges that you just can't get on other sites, free or pay.
The ultimate goal, of course, would be to import these images into Google Earth. They do have one radar service I saw, but it wasn't very good because it had the company's logo written all over the freakin' map.
In any case, between this and the other NWS stuff I've worked on earlier this year, I almost have enough to put together for a desktop weather app. Might be interesting to see how far I can go with this.Labels: Coding, NWS, Screenshot
|
| Wednesday, July 06, 2005 |
Stagnant and frustrated
Posted: 1:42:00 PM
|
Now playing: Antony Raijekov - Mapped (5:39)
Not a whole lot has been going on. I've become pretty stagnant over the last month. That sucks.
Not that I haven't been doing anything, though. Those that have the slightest of a conjecture as to what I've been doing should not be surprised in knowing that I've been kept busy with some new stuff over the past month. The "newness" of it has worn off, so hopefully that means I'll be working on my own stuff again.
Last couple of days has seen me working on a project using .NET with TCP/IP sockets and threading. It's scary the ease with which I understand this stuff, I had a working prototype in a matter of like an hour and a half. But the interesting thing to me is how this project came about in the first place... simply put, frustration with using something similar, and the drive to do it better. Lately, though, more than that has been needed for me to get anything done. Plus, even if I complete this project, I know for a fact that it won't get used. I guess it's more for personal "can I do it" curiosity.
The project I had posted about with the NWS stuff before has stalled entirely. Turns out the guy I was going to be working on it with moved, and it was decided the effort to do it wasn't work it. Of course, he has *since* told me that it might be up and running again... I don't know. Sometimes I feel like I should just work on the project and then one day dump the finished product into his lap and say "do something with this, dammit". Maybe that's what I need to do.
And on a final note of frustration, I decided to process my logs for the first time after three months. What a painfully long and ridiculous process that has turned out to be, I'm going to have to write something that does this for me daily.Labels: Coding, Logs, NWS, roncli.com
|
| Friday, April 01, 2005 |
NWS? XML? NDFD? XPATH?
Posted: 2:38:00 PM
|
Now playing: Atomship - Pencil Fight (3:38)
Seems there's an acronym for everything these days. I guess I'm one of the few that prefer to write out my words. You know, self-documentation and all.
Anyway, I am apparantly on a roll with the NWS stuff I've been working on. I can now read the forecast, current conditions, and severe weather alerts for a particular zip code, reloading as appropriate. All the hard work is done, which means the fun stuff is next, displaying the data. I have a pretty good idea of what I want to do for this, and it'll be quite fun to work on. Having learned a bit about VB.Net's 2D drawing capability and already having played around with Crystal Space's 2D drawing, I have a pretty good idea what I'm in for, so it shouldn't be too difficult to figure out.Labels: Acronyms, Coding, Crystal Space, NWS
|
| Thursday, March 31, 2005 |
Updated NWS Code
Posted: 10:17:00 PM
|
Now playing: Atomship - Pencil Fight (3:38)
Mikhail's code was enough to get me started on combining all of the various parameters I wanted (just the relative ones, none of this dewpoint crap) together to come up with one single variable that has all of the forecast possible for one location.
#Region "Structs"

    Private Structure WeatherTable
        Public nodTimeLayout As XmlNode
        Public nodData As XmlNode
    End Structure

    Private Structure WeatherData
        Public wtHighTemp As WeatherTable
        Public wtLowTemp As WeatherTable
        Public wtPointTemp As WeatherTable
        Public wtLiquidPrecip As WeatherTable
        Public wtSnowPrecip As WeatherTable
        Public wtPrecipProb As WeatherTable
        Public wtWindSpeed As WeatherTable
        Public wtWindDirection As WeatherTable
        Public wtCloudCover As WeatherTable
    End Structure

    Private Structure TemperatureData
        Public F As Integer
        Public ReadOnly Property C() As Integer
            Get
                Return Integer.Parse(Math.Round(((Double.Parse(F) - 32) / 9) * 5))
            End Get
        End Property
        Public dt As Date
    End Structure

    Private Structure PrecipitationData
        Public Inches As Double
        Public ReadOnly Property MM() As Double
            Get
                Return Inches * 25.4
            End Get
        End Property
        Public dt As Date
    End Structure

    Private Structure PercentData
        Public Pct As Integer
        Public dt As Date
    End Structure

    Private Structure WindData
        Public Knots As Integer
        Public ReadOnly Property MPH() As Integer
            Get
                Return Integer.Parse(Math.Round((Double.Parse(Knots) * 6076.12) / 5280))
            End Get
        End Property
        Public Degrees As Integer
        Public ReadOnly Property Dir() As String
            Get
                Select Case Degrees
                    Case 0 To 11.25, 348.75 To 360
                        Return "N"
                    Case 11.25 To 33.75
                        Return "NNE"
                    Case 33.75 To 56.25
                        Return "NE"
                    Case 56.25 To 78.75
                        Return "ENE"
                    Case 78.75 To 101.25
                        Return "E"
                    Case 101.25 To 123.75
                        Return "ESE"
                    Case 123.75 To 146.25
                        Return "SE"
                    Case 146.25 To 168.75
                        Return "SSE"
                    Case 168.75 To 191.25
                        Return "S"
                    Case 191.25 To 213.75
                        Return "SSW"
                    Case 213.75 To 236.25
                        Return "SW"
                    Case 236.25 To 258.75
                        Return "WSW"
                    Case 258.75 To 281.25
                        Return "W"
                    Case 281.25 To 303.75
                        Return "WNW"
                    Case 303.75 To 326.25
                        Return "NW"
                    Case 326.25 To 348.75
                        Return "NNW"
                End Select
            End Get
        End Property
        Public dt As Date
    End Structure

    Private Structure FormattedWeatherData
        Public HighTemp() As TemperatureData
        Public LowTemp() As TemperatureData
        Public PointTemp() As TemperatureData
        Public LiquidPrecip() As PrecipitationData
        Public SnowPrecip() As PrecipitationData
        Public PrecipProb() As PercentData
        Public Wind() As WindData
        Public CloudCover() As PercentData
    End Structure

#End Region

#Region "NWS XML Reader http://www.nws.noaa.gov/forecasts/xml"

    Private Function FindLayoutTable(ByVal xmlDoc As XmlDocument, ByVal nodData As XmlNode)
        Dim nlTimeLayouts As XmlNodeList = xmlDoc.SelectNodes("/dwml/data/time-layout")
        Dim strTimeLayout As String = nodData.Attributes("time-layout").Value

        Dim node As XmlNode
        For Each node In nlTimeLayouts
            If strTimeLayout = node.SelectSingleNode("layout-key").InnerText Then
                Return node
            End If
        Next

        Return Nothing
    End Function

    Private Function ParseDateTime(ByVal str As String) As Date
        Return Date.Parse(str.Replace("T", " ").Substring(0, str.LastIndexOf("-")))
    End Function

    Private Sub FillTemperatureData(ByVal wt As WeatherTable, ByRef temp() As TemperatureData)
        Dim intCount As Integer

        Dim nlData As XmlNodeList = wt.nodData.SelectNodes("value")
        Dim nlDate As XmlNodeList = wt.nodTimeLayout.SelectNodes("start-valid-time")
        For intCount = 0 To UBound(temp) - 1
            temp(intCount) = New TemperatureData()
            temp(intCount).F = Integer.Parse(nlData(intCount).InnerText)
            temp(intCount).dt = ParseDateTime(nlDate(intCount).InnerText)
        Next
    End Sub

    Private Sub FillPrecipitationData(ByVal wt As WeatherTable, ByRef precip() As PrecipitationData)
        Dim intCount As Integer

        Dim nlData As XmlNodeList = wt.nodData.SelectNodes("value")
        Dim nlDate As XmlNodeList = wt.nodTimeLayout.SelectNodes("start-valid-time")
        For intCount = 0 To UBound(precip) - 1
            precip(intCount) = New PrecipitationData()
            If Len(nlData(intCount).InnerText) = 0 Then
                precip(intCount).Inches = 0
            Else
                precip(intCount).Inches = Double.Parse(nlData(intCount).InnerText)
            End If
            precip(intCount).dt = ParseDateTime(nlDate(intCount).InnerText)
        Next
    End Sub

    Private Sub FillPercentData(ByVal wt As WeatherTable, ByRef pct() As PercentData)
        Dim intCount As Integer

        Dim nlData As XmlNodeList = wt.nodData.SelectNodes("value")
        Dim nlDate As XmlNodeList = wt.nodTimeLayout.SelectNodes("start-valid-time")
        For intCount = 0 To UBound(pct) - 1
            pct(intCount) = New PercentData()
            pct(intCount).Pct = Integer.Parse(nlData(intCount).InnerText)
            pct(intCount).dt = ParseDateTime(nlDate(intCount).InnerText)
        Next
    End Sub

    Private Sub FillWindData(ByVal wtSpeed As WeatherTable, ByVal wtDir As WeatherTable, ByRef wind() As WindData)
        Dim intCount As Integer

        Dim nlSpeed As XmlNodeList = wtSpeed.nodData.SelectNodes("value")
        Dim nlDir As XmlNodeList = wtDir.nodData.SelectNodes("value")
        Dim nlDate As XmlNodeList = wtSpeed.nodTimeLayout.SelectNodes("start-valid-time")
        For intCount = 0 To UBound(wind) - 1
            wind(intCount) = New WindData()
            wind(intCount).Knots = Integer.Parse(nlSpeed(intCount).InnerText)
            wind(intCount).Degrees = Integer.Parse(nlDir(intCount).InnerText)
            wind(intCount).dt = ParseDateTime(nlDate(intCount).InnerText)
        Next
    End Sub

    Private Function ParseForecastXML(ByVal strXMLWeather) As FormattedWeatherData
        Try
            'Setup variables
            Dim xmlDoc As New XmlDocument()
            Dim wdData As New WeatherData()
            Dim fwdData As New FormattedWeatherData()
            wdData.wtHighTemp = New WeatherTable()
            wdData.wtLowTemp = New WeatherTable()
            wdData.wtPointTemp = New WeatherTable()
            wdData.wtLiquidPrecip = New WeatherTable()
            wdData.wtSnowPrecip = New WeatherTable()
            wdData.wtPrecipProb = New WeatherTable()
            wdData.wtWindSpeed = New WeatherTable()
            wdData.wtWindDirection = New WeatherTable()
            wdData.wtCloudCover = New WeatherTable()

            'Load XML data
            xmlDoc.LoadXml(strXMLWeather)

            'Load data and their corresponding time nodes
            wdData.wtHighTemp.nodData = xmlDoc.SelectSingleNode("/dwml/data/parameters/temperature[@type='maximum']")
            wdData.wtLowTemp.nodData = xmlDoc.SelectSingleNode("/dwml/data/parameters/temperature[@type='minimum']")
            wdData.wtPointTemp.nodData = xmlDoc.SelectSingleNode("/dwml/data/parameters/temperature[@type='hourly']")
            wdData.wtLiquidPrecip.nodData = xmlDoc.SelectSingleNode("/dwml/data/parameters/precipitation[@type='liquid']")
            wdData.wtSnowPrecip.nodData = xmlDoc.SelectSingleNode("/dwml/data/parameters/precipitation[@type='snow']")
            wdData.wtPrecipProb.nodData = xmlDoc.SelectSingleNode("/dwml/data/parameters/probability-of-precipitation[@type='12 hour']")
            wdData.wtWindSpeed.nodData = xmlDoc.SelectSingleNode("/dwml/data/parameters/wind-speed[@type='sustained']")
            wdData.wtWindDirection.nodData = xmlDoc.SelectSingleNode("/dwml/data/parameters/direction[@type='wind']")
            wdData.wtCloudCover.nodData = xmlDoc.SelectSingleNode("/dwml/data/parameters/cloud-amount[@type='total']")

            wdData.wtHighTemp.nodTimeLayout = FindLayoutTable(xmlDoc, wdData.wtHighTemp.nodData)
            wdData.wtLowTemp.nodTimeLayout = FindLayoutTable(xmlDoc, wdData.wtLowTemp.nodData)
            wdData.wtPointTemp.nodTimeLayout = FindLayoutTable(xmlDoc, wdData.wtPointTemp.nodData)
            wdData.wtLiquidPrecip.nodTimeLayout = FindLayoutTable(xmlDoc, wdData.wtLiquidPrecip.nodData)
            wdData.wtSnowPrecip.nodTimeLayout = FindLayoutTable(xmlDoc, wdData.wtSnowPrecip.nodData)
            wdData.wtPrecipProb.nodTimeLayout = FindLayoutTable(xmlDoc, wdData.wtPrecipProb.nodData)
            wdData.wtWindSpeed.nodTimeLayout = FindLayoutTable(xmlDoc, wdData.wtWindSpeed.nodData)
            wdData.wtWindDirection.nodTimeLayout = FindLayoutTable(xmlDoc, wdData.wtWindDirection.nodData)
            wdData.wtCloudCover.nodTimeLayout = FindLayoutTable(xmlDoc, wdData.wtCloudCover.nodData)

            'Setup formatted data variables
            ReDim fwdData.HighTemp(wdData.wtHighTemp.nodTimeLayout.SelectNodes("start-valid-time").Count)
            ReDim fwdData.LowTemp(wdData.wtLowTemp.nodTimeLayout.SelectNodes("start-valid-time").Count)
            ReDim fwdData.PointTemp(wdData.wtPointTemp.nodTimeLayout.SelectNodes("start-valid-time").Count)
            ReDim fwdData.LiquidPrecip(wdData.wtLiquidPrecip.nodTimeLayout.SelectNodes("start-valid-time").Count)
            ReDim fwdData.SnowPrecip(wdData.wtSnowPrecip.nodTimeLayout.SelectNodes("start-valid-time").Count)
            ReDim fwdData.PrecipProb(wdData.wtPrecipProb.nodTimeLayout.SelectNodes("start-valid-time").Count)
            ReDim fwdData.Wind(wdData.wtWindSpeed.nodTimeLayout.SelectNodes("start-valid-time").Count)
            ReDim fwdData.CloudCover(wdData.wtCloudCover.nodTimeLayout.SelectNodes("start-valid-time").Count)

            'Fill in data
            FillTemperatureData(wdData.wtHighTemp, fwdData.HighTemp)
            FillTemperatureData(wdData.wtLowTemp, fwdData.LowTemp)
            FillTemperatureData(wdData.wtPointTemp, fwdData.PointTemp)
            FillPrecipitationData(wdData.wtLiquidPrecip, fwdData.LiquidPrecip)
            FillPrecipitationData(wdData.wtSnowPrecip, fwdData.SnowPrecip)
            FillPercentData(wdData.wtPrecipProb, fwdData.PrecipProb)
            FillWindData(wdData.wtWindSpeed, wdData.wtWindDirection, fwdData.Wind)
            FillPercentData(wdData.wtCloudCover, fwdData.CloudCover)

            Return fwdData

        Catch ex As Exception
            Return Nothing
        End Try
    End Function

#End Region
A little more complicated in some ways, a bit simpler in others, but the data is complete. To call the web service and retrieve the data:
        Dim weather As New gov.weather.ndfdXML()
        Dim params As New gov.weather.weatherParametersType()
        params.maxt = True
        params.mint = True
        params.temp = True
        params.qpf = True
        params.snow = True
        params.pop12 = True
        params.wspd = True
        params.wdir = True
        params.sky = True
        Dim fwdWeather as FormattedWeatherData = ParseForecastXML(weather.NDFDgen(sngLatitude, sngLongitude, "time-series", Now, Now.AddDays(30), params))
        weather = Nothing
        params = Nothing
fwdWeather now has all the forecasting data you need. It also has easy functions to convert F to C, Knots to MPH, and Inches to Millimeters.
Not bad for a day of research and coding! Now if only they'd make web services for current conditions and severe weather statements, I'd be all set.Labels: Coding, NWS, VB.NET
|
NWS XML web service for VB.Net
Posted: 5:35:00 PM
|
Now playing: Atomship - Pencil Fight (3:38)
In my quest for consuming the NWS XML Web Service, I came across this blog post by Mikhail Arkhipov over at Microsoft. He has available for download a bit of code that allows you to consume said web service. Problem is, it's in C#.Net.
After reading the code and finally understanding NWS's NDFD format, I went ahead and converted the C#.Net code to VB.Net. Now, this isn't the first time I've done something with C# code, so it was fairly easy to go through the code and come up with a VB.Net equivalent. In fact, it was dead easy.
Anyway, I figured I'd post my conversion. The code is practically identical, except I chagned the variable names to suit the standards I'm used to.
First, create a new project and add a web reference to http://weather.gov/forecasts/xml/SOAP_server/ndfdXMLserver.php?wsdl. This will hook you into NWS's free service.
Second, add this bit of code to your project.
#Region "Structs"

    Private Structure DayWeatherData
        Public dtDate As Date
        Public strLowTempF As String
        Public strHighTempF As String
        Public strLowTempC As String
        Public strHighTempC As String
        Public strCloudIconURL As String
    End Structure

    Private Structure WeatherTable
        Public nodTimeLayout As XmlNode
        Public nodData As XmlNode
    End Structure

#End Region

#Region "NWS XML Reader http://www.nws.noaa.gov/forecasts/xml"
    'Converted to VB.Net by Ronald M. Clifford
    'Original C#.Net by Mikhail Arkhipov

    Private Function FindLayoutTable(ByVal xmlDoc As XmlDocument, ByVal nodData As XmlNode)
        Dim nlTimeLayouts As XmlNodeList = xmlDoc.SelectNodes("/dwml/data/time-layout")
        Dim strTimeLayout As String = nodData.Attributes("time-layout").Value

        Dim node As XmlNode
        For Each node In nlTimeLayouts
            If strTimeLayout = node.SelectSingleNode("layout-key").InnerText Then
                Return node
            End If
        Next

        Return Nothing
    End Function

    Private Sub FillLowTemperatures(ByVal nodXML As XmlNode, ByRef dwdData() As DayWeatherData)
        Dim nlNodes As XmlNodeList = nodXML.SelectNodes("value")

        Dim intCount As Integer
        For intCount = 0 To UBound(dwdData) - 1
            dwdData(intCount).strLowTempF = nlNodes(intCount).InnerText
            dwdData(intCount).strLowTempC = Math.Round(5 * (Double.Parse(dwdData(intCount).strLowTempF) - 32) / 9).ToString
        Next
    End Sub

    Private Sub FillHighTemperatures(ByVal nodXML As XmlNode, ByRef dwdData() As DayWeatherData)
        Dim nlNodes As XmlNodeList = nodXML.SelectNodes("value")

        Dim intCount As Integer
        For intCount = 0 To UBound(dwdData) - 1
            dwdData(intCount).strHighTempF = nlNodes(intCount).InnerText
            dwdData(intCount).strHighTempC = Math.Round(5 * (Double.Parse(dwdData(intCount).strHighTempF) - 32) / 9).ToString
        Next
    End Sub

    Private Function ParseDateTime(ByVal str As String) As Date
        Return Date.Parse(str.Replace("T", " ").Substring(0, str.LastIndexOf("-")))
    End Function

    Private Sub FillDayNameAndTime(ByVal nodLows As XmlNodeList, ByVal nodHighs As XmlNodeList, ByRef dwdData() As DayWeatherData)
        ' Choose first elemnt from low or high list depending on what is close to the current time.
        ' Typically weather report is about 'today' or 'tonight' on the current day or about
        ' day temperatures for the coming days. Therefoce remaining elements always come from
        ' the high temperatures list.

        Dim dtFirstLow As Date = ParseDateTime(nodLows(0).InnerText)
        Dim dtFirstHigh As Date = ParseDateTime(nodHighs(0).InnerText)
        Dim dtNow As Date = Now
        Dim nlNodes As XmlNodeList

        If dtFirstLow.Day = dtNow.Day And dtFirstHigh.Day = dtNow.Day Then
            ' choose nearest
            Dim intDiffFromLow = Math.Abs(dtFirstLow.Hour - dtNow.Hour)
            Dim intDiffFromHigh = Math.Abs(dtFirstHigh.Hour - dtNow.Hour)

            If intDiffFromHigh < intDiffFromLow Then
                nlNodes = nodHighs
            Else
                nlNodes = nodLows
            End If
        ElseIf dtFirstHigh.Day = dtNow.Day Then
            ' choose highs
            nlNodes = nodHighs
        Else
            ' choose lows
            nlNodes = nodLows
        End If

        Dim intCount As Integer

        For intCount = 0 To UBound(dwdData) - 1
            Dim dt As Date = ParseDateTime(nlNodes(intCount).InnerText)

            If intCount = 0 Then
                dwdData(intCount).dtDate = dt
            Else
                dwdData(intCount).dtDate = New Date(dt.Year, dt.Month, dt.Day, 12, 0, 0)
            End If
        Next
    End Sub

    Private Sub FillCloudData(ByVal wt As WeatherTable, ByRef dwdData() As DayWeatherData)
        ' Cloud data is typically much longer than day high/low data
        ' We need to find times that match ones in high and low temp tables.
        Dim nlTimes As XmlNodeList = wt.nodTimeLayout.SelectNodes("start-valid-time")
        Dim nlIcons As XmlNodeList = wt.nodData.SelectNodes("icon-link")

        Dim intWeatherData As Integer = 0
        Dim intNodes As Integer = 0
        Dim intHourDiff As Integer = Integer.MaxValue

        Dim nodXML As XmlNode
        For Each nodXML In nlTimes
            Dim dt As Date = ParseDateTime(nodXML.InnerText)

            If dt.Date > dwdData(intWeatherData).dtDate.Date Then
                intWeatherData += 1

                If intWeatherData > UBound(dwdData) Then Exit For

                intHourDiff = Integer.MaxValue
            End If

            If dt.Date = dwdData(intWeatherData).dtDate.Date Then
                Dim intDiff As Integer = Math.Abs(dt.Hour - dwdData(intWeatherData).dtDate.Hour)

                If intDiff < intHourDiff Then
                    intHourDiff = intDiff
                    dwdData(intWeatherData).strCloudIconURL = nlIcons(intNodes).InnerText
                End If
            End If

            intNodes += 1
        Next
    End Sub

    Private Function ParseWeatherXML(ByVal strXMLWeather) As DayWeatherData()
        Try
            Dim dwd() As DayWeatherData
            Dim xmlDoc As New XmlDocument()

            ' load XML data into a tree
            xmlDoc.LoadXml(strXMLWeather)

            ' locate dwml/data/time-layout nodes. There should be three of them:
            '      - next week nighttime temperatures (lows)
            '      - next week daytime temperatures (highs)
            '      - next week cloud data

            ' Find roots nodes for temperature and cloud data
            Dim wtLowTemp As New WeatherTable()
            Dim wtHighTemp As New WeatherTable()
            Dim wtClouds As New WeatherTable()

            wtLowTemp.nodData = xmlDoc.SelectSingleNode("/dwml/data/parameters/temperature[@type='minimum']")
            wtHighTemp.nodData = xmlDoc.SelectSingleNode("/dwml/data/parameters/temperature[@type='maximum']")
            wtClouds.nodData = xmlDoc.SelectSingleNode("/dwml/data/parameters/conditions-icon")

            ' Find out corresponding time layout table for each top data node
            wtLowTemp.nodTimeLayout = FindLayoutTable(xmlDoc, wtLowTemp.nodData)
            wtHighTemp.nodTimeLayout = FindLayoutTable(xmlDoc, wtHighTemp.nodData)
            wtClouds.nodTimeLayout = FindLayoutTable(xmlDoc, wtClouds.nodData)

            ' Number of day data is min of low and high temperatures
            Dim nlLowTimes As XmlNodeList = wtLowTemp.nodTimeLayout.SelectNodes("start-valid-time")
            Dim nlHighTimes As XmlNodeList = wtHighTemp.nodTimeLayout.SelectNodes("start-valid-time")

            Dim intTimes As Integer = Math.Min(nlLowTimes.Count, nlHighTimes.Count)

            Dim dwdData(intTimes) As DayWeatherData

            Dim intCount As Integer
            For intCount = 0 To intTimes - 1
                dwdData(intCount) = New DayWeatherData()
            Next

            ' Fill highs and lows
            FillLowTemperatures(wtLowTemp.nodData, dwdData)
            FillHighTemperatures(wtHighTemp.nodData, dwdData)

            FillDayNameAndTime(nlLowTimes, nlHighTimes, dwdData)

            FillCloudData(wtClouds, dwdData)

            Return dwdData

        Catch ex As Exception
            Return Nothing
        End Try
    End Function

#End Region
Finally, simply make a call to their web service.
        Dim weather As New gov.weather.ndfdXML()
        Dim params As New gov.weather.weatherParametersType()
        params.maxt = True
        params.mint = True
        params.icons = True
        Dim strWeatherXML As String = weather.NDFDgen(39, -77, "time-series", Now, Now.AddDays(5), params)
        weather = Nothing
        params = Nothing
        Dim dwdWeather() As DayWeatherData = ParseWeatherXML(strWeatherXML)
You now have a DayWeatherData object, dwdWeather, that contains the highs and lows for the day, along with a URL to an icon that displays the type of weather to expect for the day. This is ultra basic. If you check out the NWS site, you'll find there are many other options you can add in, including cloud cover, percipitation chance and amount, and a couple other things. You'll have to code the XML reader to parse these things, but it's pretty easily done. And best of all, it's free!
The only down side to this is that you need to come up with the latitude and longitude (negative for the western hemisphere) for the location you want to use, which means you'll need to grab a Zip Code to latitude & longitude database.Labels: Coding, NWS, VB.NET
|
Web Junkie
Posted: 5:16:00 PM
|
Now playing: Atomship - Pencil Fight (3:38)
Here it is about 5:15 in the afternoon. I've been up since about 8 in the morning, mostly trying to figure out the NWS XML web service. I eventually got it (more on that in my next post) thanks to a website that had downloadable code available that consumes the service.
So, I wanted to make a post here in my blog about it. I open up Crazy Browser, got to the history, and click on "today". How many freaking websites did I visit today?! The list is absolutely ENORMOUS, showing over 100 sites.
Am I a junkie or what?Labels: Coding, Crazy Browser, Life, NWS
|
|
